My Third Data Analysis Project Experience: It’s Getting Better.
- Ebenezer Adebiyi

- May 25, 2022
- 3 min read
Updated: May 28, 2022
My previous experience on projects has been my major motivation to keep analyzing and visualizing data. I realized that the more I work on projects, the more I learn new things, methods, and better ways to approach and analyze complex data. Through working on projects, I have learned a better way to format, split, and combine data. I, also, learned the limitations of Vlookup, how to combine index and match functions, how to edit and link slicer to all pivot tables, how to easily delete blank rows, and remove it from slicer. I, actually, thought I knew all of these things and when to apply them until I started working on a project. If not for the projects I worked on, I would not have really known and understood those methods. So, I see project as a way to relearn as well as build my portfolio and increase my arsenal.
Having worked on sales and Google Playstore application projects, I felt I needed to work on an entertainment project in order to understand how the entertainment industry has evolved over the last few decades. While looking for an entertainment dataset on Kaggle (an online dataset platform), I came across 1998–2019 spotify dataset, so I decided to run a full analysis to get a sense of the artists and music genres that have dominated Spotify over the years.

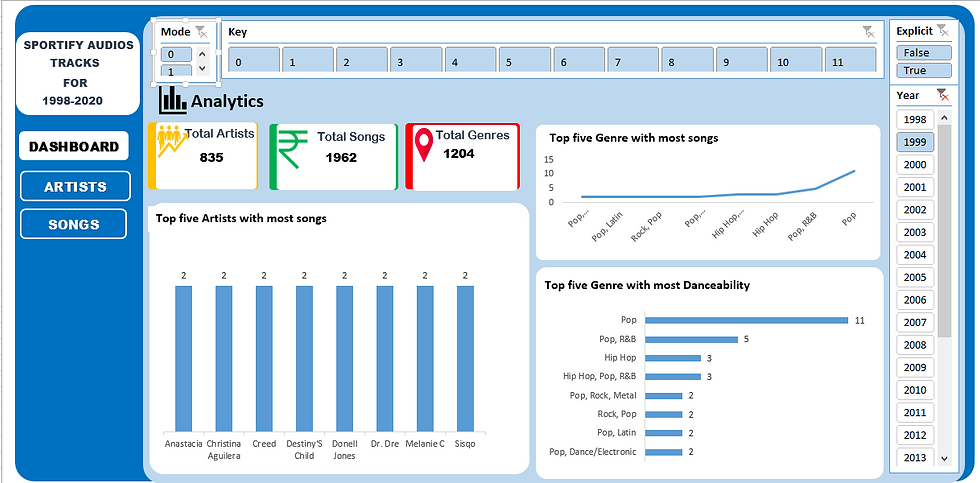
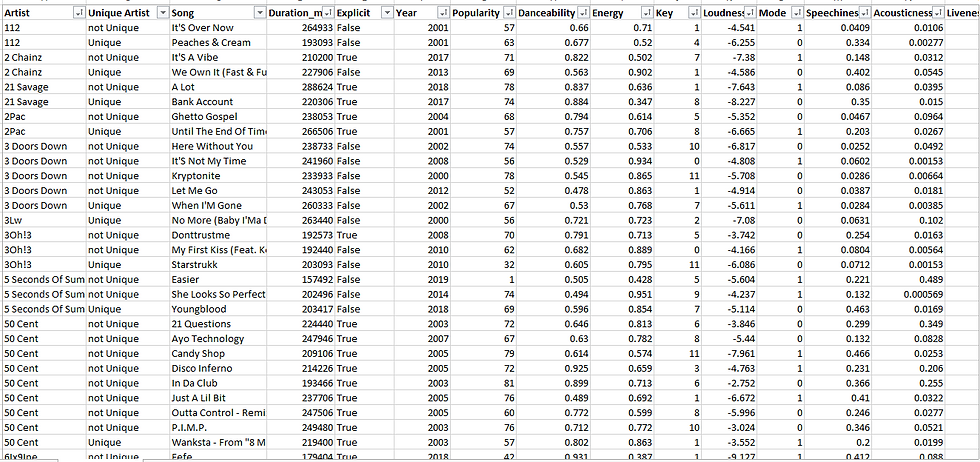
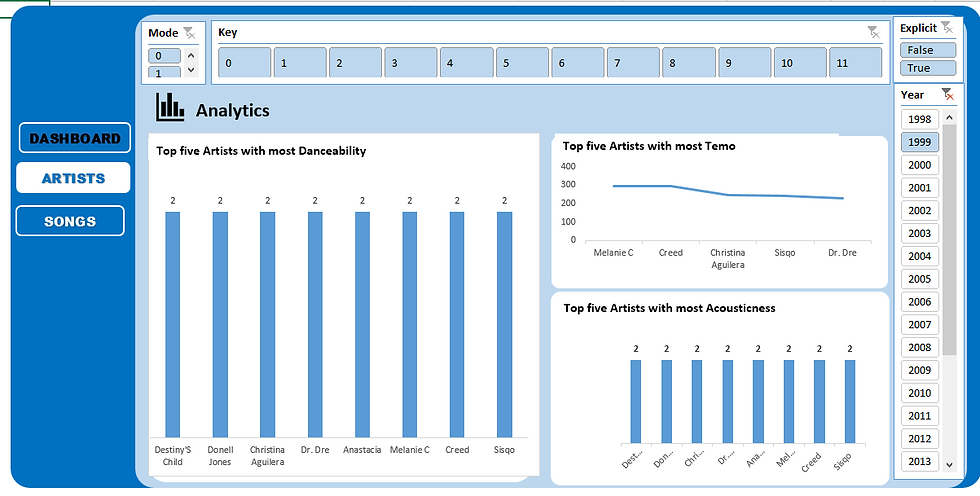
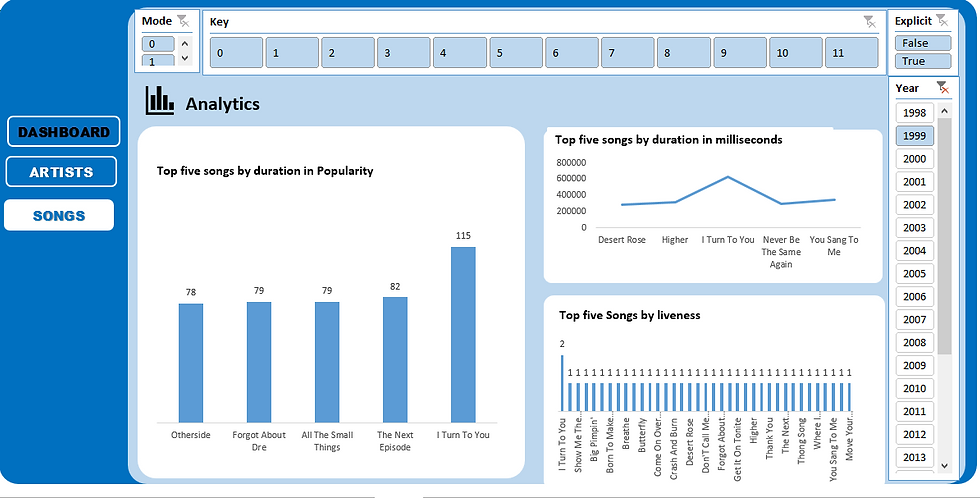
I downloaded the open source data in csv format and imported it to excel. The dataset consists of 1,942 rows and 17 columns. The column consists of the artist, song, duration in milliseconds, year the track was released, the popularity of the song, Dance ability (describe the track's suitability for dancing), Energy (describe the perceptual measure of intensity and activity)The key , the loudness in decibels, mode (describe the major and minor), speechiness (describe the presence of spoken words in the track), acoustiness (describe the confidence measure from 0.0 to 1.0), liveness (describe the presence of an audience in the recording), valence (describing the positiveness conveyed by the track), tempo (describe the overall estimated track in beats per minute), genre (describe the genre of the track). My goals and objectives for this dataset are to: determine the artist with the most songs; genres with the most songs; genres with the most danceability; the artist by danceability; the artists with the most tempo; the artist with the most acousticness; the top song by liveness; the top song by Duration_ms; the top song by Popularity.

I removed duplicates and transformed the disorganized data into an organized and structured format during data cleaning. The most difficult challenge I encountered while analyzing the data was determining the total number of artists. Because some artists appear more than once, with different songs and properties, removing the duplicate would be ineffective in this case. I attempted to count the distinct, but my efforts were otiose until I reached out to my best friend, YouTube. I learned how to easily count it through her by creating another column and using the logical statement "If" function to determine the unique and non-unique artists. As a result, I consider the unique to be the total artist. Isn't it simple? Yes, my friend is the surest.
In visualizing the data, I want to communicate my results and findings in terms of songs and artists. I doubted whether it was possible to have more than a dashboard for a dataset. I reached out to one of my best friends, Google, but I was not satisfied with what I got. Then I reached out to another best friend, Youtube. Yes, my gee! I got to learn how to link dashboards together through the Eduworld channel. I replicated the process and phew! I arrived at my dashboard. No doubt, the journey is fun.

According to my analysis and visualization, I discovered that Drake and Rihanna are the artists with the most songs and danceability, with a total of 23 songs, respectively. Pop has the highest genre and danceability with 420 songs, respectively. Rihanna has the most Temo with a total of 2,900. Britney spears has the most acousticness with a total of 4. The song Closer is the most popular, while Sorry has the most duration and Liveness.

I published this project on Github: https://github.com/Awaitingprof/Spotify_data.git


well done bro, this is well detailed
Good one
Weldon
Amazing
Nice one sir 👍
Insightful.
Nice one